Valuable fiber assets often sit unused while providers build costly new infrastructure alongside them. Why? Because many providers simply can't see what they already have.
As the fiber market continues its explosive growth—expanding from $13.92 billion in 2025 to a projected $20.89 billion by 2030— providers with limited network visibility will struggle to capitalize on opportunities.1 With fiber broadband connections growing 13% in 2024 alone and now reaching 35.1 million American homes, competition for market share is intensifying.2
In our previous post, we explored how manual processes slow down proposal creation, causing fiber providers to miss opportunities. Now, we turn to another critical challenge: limited visibility into network assets.
Challenge #2: Poor visibility into network assets
Limited network visibility creates serious competitive disadvantages for fiber providers. When teams can't quickly determine available network resources, they face multiple challenges:
- Identifying available fiber capacity in specific geographic areas
- Distinguishing between leased fibers and utilized circuits
- Making informed decisions about where to build versus leveraging existing assets
- Maintaining network diversity while meeting customer requirements
For communication service providers (CSPs), the network is their core asset. Having accurate, accessible records isn't just an engineering requirement—it's essential for supporting the network itself and the customers who depend on it.
The limits of traditional asset management approaches
Many providers track their assets through methods that fall short of providing the visibility needed to make confident, timely decisions during the proposal process.
While spreadsheets and databases provide basic tracking of infrastructure like fiber strands and splice closures, they typically lack spatial context. Without understanding where these assets exist geographically, teams struggle to include them effectively in proposals.
Some providers use basic maps to track leased fibers, which helps assess available versus used assets. However, these systems often can't distinguish between leased fibers and active circuits, creating confusion during the proposal process and leading to inefficient resource allocation.
The result? Teams waste time on proposals that require excessive new builds when existing assets could have been leveraged, or they create inaccurate proposals that promise network diversity that can't actually be delivered.
Enhanced asset utilization through GIS
Many GIS platforms transform asset management by bringing connectivity data into a spatial environment. This integration is particularly valuable as providers race to capture their share of the expanding market, which saw 10.3 million new homes marketed with fiber in 2024—up from 9.1 million the previous year.2 This integration provides:
- Comprehensive visualization of network availability and capacity
- Ability to differentiate between leased fibers and assigned circuits
- Clear indications of diversity options and redundancy paths
- Integrated administrative counts in map labels and symbology
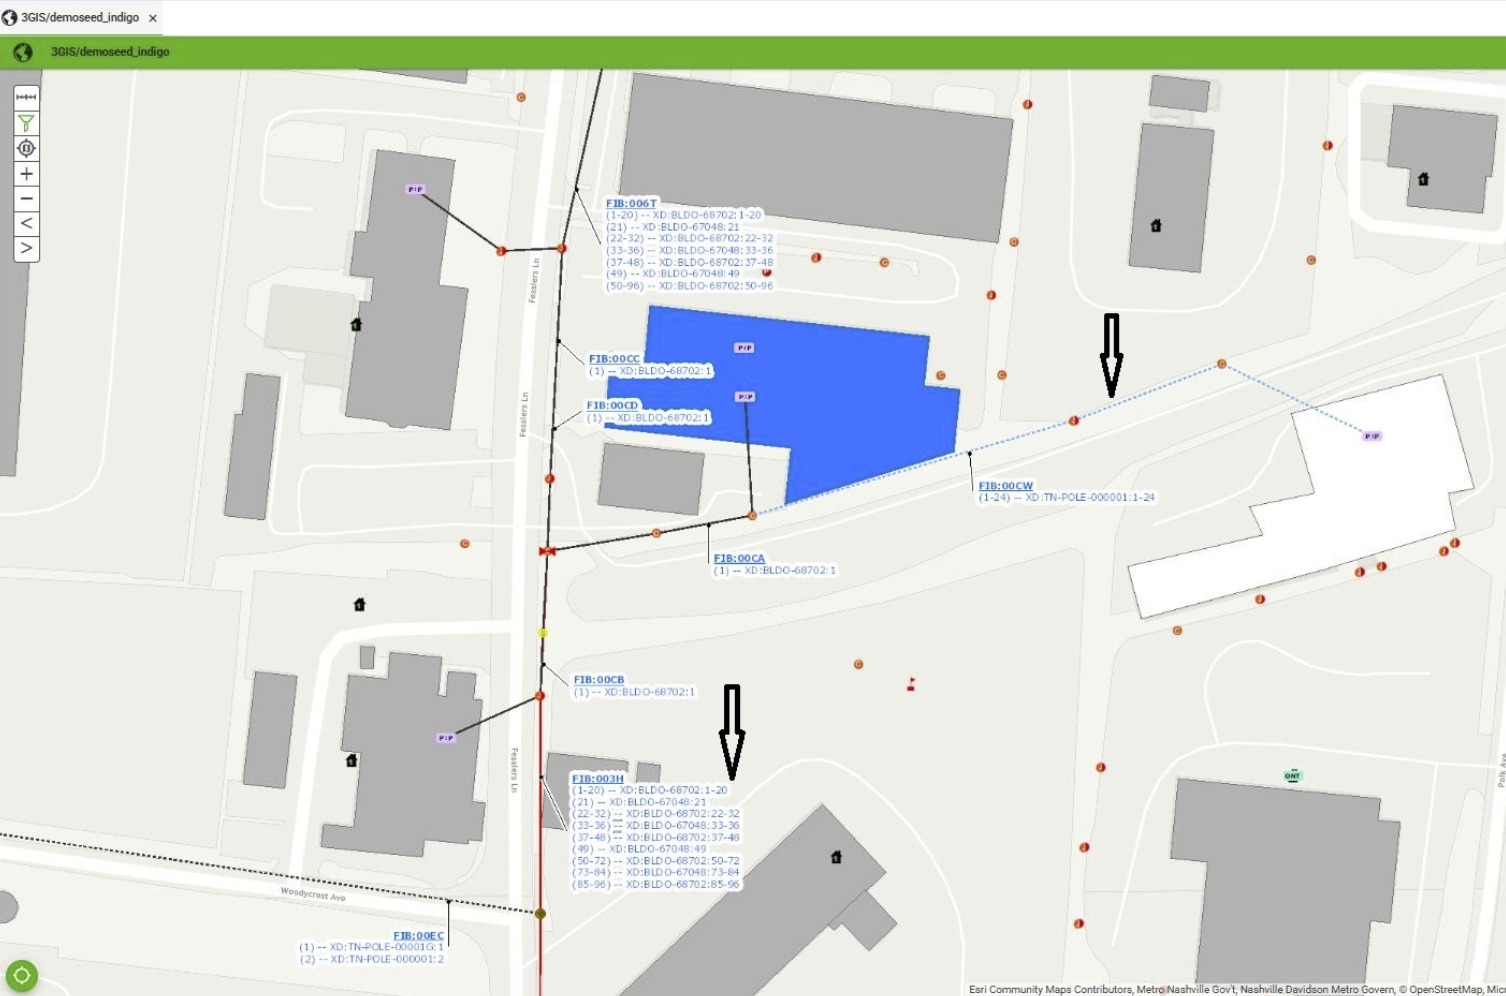
Some advanced tools, like the Availability feature in 3-GIS | Web, make this information instantly accessible. These solutions combine data about total fiber count in cables, assigned circuits, and leased fibers to give users an immediate view of what's available for new opportunities.

Using the Availability tool in 3-GIS | Web to visualize fiber usage
The "island approach" to network expansion
Beyond improving visibility into existing assets, GIS tools enable providers to pursue an "island approach" to network expansion. Rather than focusing solely on contiguous growth, this strategy involves targeting high-opportunity areas even when they're not adjacent to existing network footprints.
This approach helps providers keep fiber expansion costs down while still growing their service territory. For newer market entrants especially, "market selection and neighborhood prioritization are paramount, necessitating comprehensive analysis of competition, potential build costs, and growth trends”.3 They can identify profitable market opportunities, evaluate the most cost-effective routes to connect these "islands" to their main network, and make data-driven decisions about where to invest in new infrastructure.
With proper asset visibility, providers can determine which islands make economic sense to pursue and which connecting routes will deliver the best return on investment.
As you work to enhance your asset visibility, consider:
- Configuring maps to enhance clarity: Configure symbology and labels to clearly show network utilization status, reducing questions and speeding up the proposal process.
- Consolidating data sources: Bring together information about leased fibers, assigned circuits, and physical assets to provide a comprehensive view of network utilization.
- Implementing real-time updates: Ensure that as network changes occur, they're reflected immediately in your fiber asset management system to prevent proposals based on outdated information.
Turning network visibility into competitive advantage
Providers who implement GIS-based asset management gain significant advantages in the proposal process. When sales teams can quickly identify available resources and understand where strategic builds make sense, they can create more competitive proposals that:
- Maximize use of existing assets to keep costs down
- Reduce unnecessary construction that increases costs and timelines
- Offer genuine network diversity that meets customer requirements
- Create accurate timelines based on actual build requirements
In our next and final post in this series, we'll explore how GIS systems enhance the accuracy of cost estimation—helping you create proposals that are competitively priced while maintaining profitability. Stay tuned.
Want to learn more about improving your fiber proposal process? Watch the full webinar or contact our team for more insights.
Citations:
1 Mordor Intelligence, "Fiber Optic Cable Market Companies, Size, Share & Information," https://www.mordorintelligence.com/industry-reports/fiber-optic-cable-market
2 RVA LLC via Fierce Network, "Fiber deployments top another record in 2024," https://www.fierce-network.com/broadband/fiber-deployments-top-another-record-2024
3 Telecom Ramblings, "Charting the Fiber Frontier: Trends, Challenges, and Opportunities for 2024 and Beyond," https://www.telecomramblings.com/2024/01/charting-the-fiber-frontier-trends-challenges-and-opportunities-for-2024-and-beyond/