The Telecom Domain Network (TDN) provides a framework for modeling telecom infrastructure within the ArcGIS Utility Network. As organizations begin working with networks built on this model, an important question is how teams will interact with and analyze the connectivity inside those networks.
One of the most important capabilities for telecom analysis is network tracing. Tracing allows teams to follow connectivity across cables, splice points, and equipment to understand how infrastructure is linked and how services move through the network.
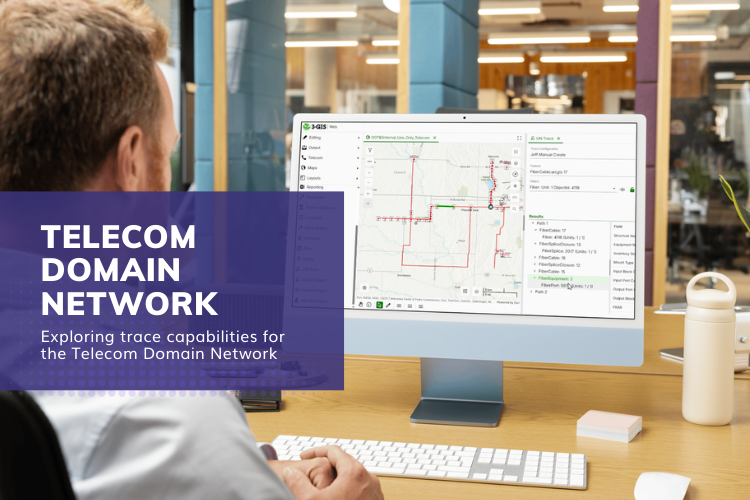
To illustrate how this works, we can look at the Utility Network tracing capability available in 3-GIS | Web. The example below shows how engineers can run different trace types and examine how connectivity is represented across the network.
Working with trace configurations
Before running a trace, teams typically define trace configurations. These configurations determine what type of analysis is performed and how results are returned.

In telecom environments, this is useful because different workflows require different types of tracing. Some scenarios require following a light path, while others require identifying every connected asset within a portion of the network.
The trace interface in 3-GIS | Web allows teams to access these predetermined named trace configurations and run them against the Utility Network data. These named traces can be created in ArcGIS Pro or through the REST endpoint and then accessed in the 3-GIS | Web Utility Network Trace tool.
Tracing paths through fiber infrastructure
One of the most common telecom workflows is identifying the path that a specific fiber follows through the network. Path tracing allows engineers to analyze how a fiber travels across cables, splice closures, and equipment as it moves through the network.

In fiber networks, cables often contain multiple individual fiber units, and a traced light path can span multiple fibers as connectivity transitions through splice closures and equipment.
By selecting a specific fiber or port unit as the starting point, engineers can trace the connected path that light follows from that location through the network.
Understanding directional trace results
When a path trace runs, the Utility Network evaluates how connectivity extends outward from the selected starting point. The results show how network elements are connected and how infrastructure extends across the network.

Depending on where the trace begins, the output may include multiple segments that represent how connectivity flows through cables, splice closures, and equipment.
This provides visibility into how the network is structured and how different assets participate in overall connectivity. It also makes it easier for teams to interpret connectivity and analyze complete paths across the network.
Exploring connected trace analysis
In addition to path traces, telecom teams often need to identify all infrastructure connected within a portion of the network.

This is where connected traces become useful. Instead of returning a specific path, a connected trace identifies every connected element within the network graph.
This type of analysis helps teams understand the broader structure of the network and the relationships between different assets.
Viewing structured trace results
Another important aspect of tracing is how the results are organized. Understanding how connectivity elements relate to one another is just as important as identifying the path itself.

Path traces can return results that group infrastructure elements based on their relationships within the network. This allows engineers to see how cables, fibers, ports, and equipment interact as part of the overall connectivity structure.
This hierarchical organization makes it easier to explore network relationships and analyze how infrastructure components work together.
Supporting telecom network analysis
As organizations begin exploring the Telecom Domain Network, capabilities like tracing will play a central role in how teams interact with their network data.
Tools like the tracing capability in 3-GIS | Web allow engineers and GIS professionals to analyze connectivity, explore light paths, and understand how infrastructure is represented within the Utility Network model.
As the Telecom Domain Network continues to evolve, these capabilities will remain important for helping organizations analyze and manage increasingly complex telecom networks.